clearString neatComponents
| |
clearString neatComponents
| |
|
clearString neatComponents E-R Diagram |
| Reference | ||
E-R Diagram | ||
The Entity-Relationship or E-R Diagram Component provides a dynamic entity-relationship imaging of the Table and Data Feeds configured within a site.
The system automatically populates the diagram with the entities and the relationship lines based on the configuration (typically of the Record Link and Multiple Record Link fields)
You can drag the entities around and resize them to make the layout clear.
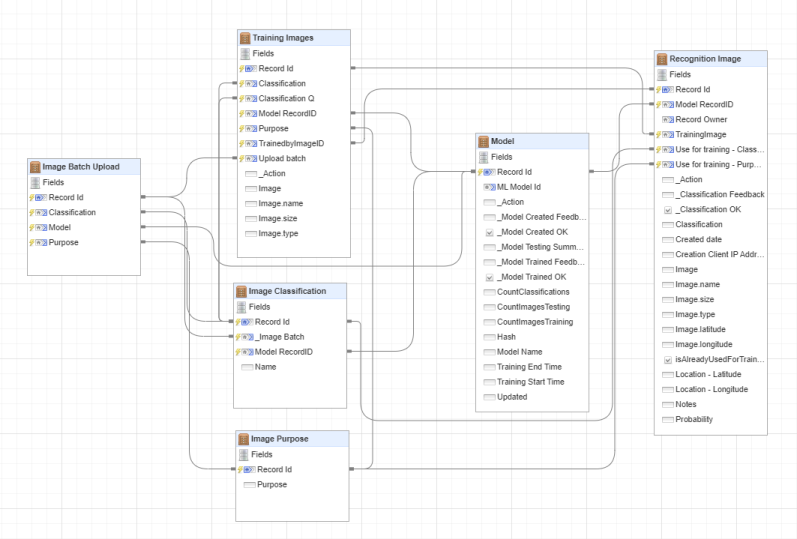
Where there are a large number of relationship lines it can become hard to follow them, even having rearranged the layout. Left-clicking the blue title bar of an entity will highlight the relationships from that entity in bold, to make them stand out from other relationship lines. Similarly, hovering the mouse over an individual relationship line will show it in bold
Right-click on an entity in the diagram to edit it:
.png)
By default the diagram shows the Fields in each entity. Double-click on the blue title bar for an entity changes this to show the Events:
.png)
.png)
Right-click on the background area of the diagram to toggle 3D view:
.png)
.png)
Copyright © 2026 Enstar LLC All rights reserved |